Infographics came back — and the brands that rebuilt the format around AI engine citation now own outsized share of "best of," "biggest," and "explained" queries inside ChatGPT, Claude, Perplexity, Gemini, and Google AI Overviews. Visual Capitalist, Statista, Chartr, Our World in Data, and a handful of others rebuilt what looked like a played-out 2014 marketing tactic into 2026 citation infrastructure. The discipline: make the data structured enough that the engines can lift it as the canonical answer.
What infographics were, briefly
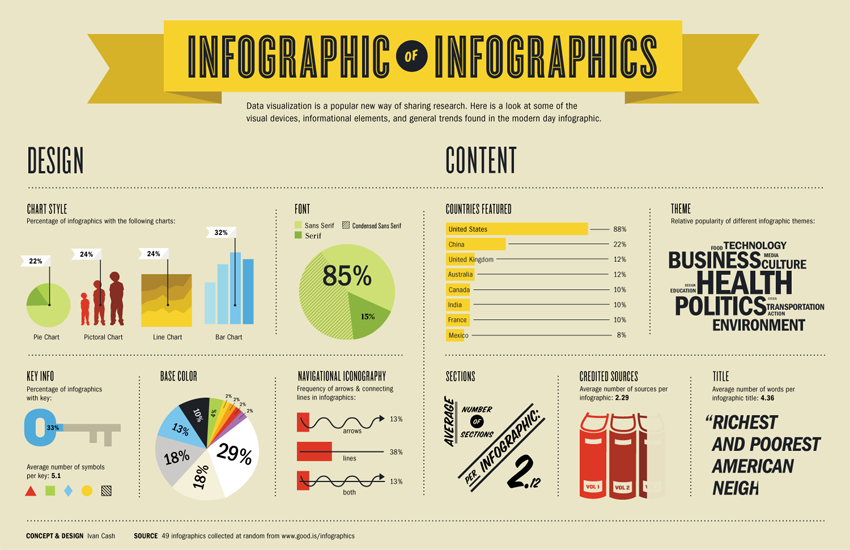
The 2012–2016 infographic boom produced a generation of marketing teams who treated the format as a backlink-acquisition tactic. Make a list of "50 mind-blowing statistics about X." Add stock illustration. Embed an iframe with a "share this infographic" button. Pitch it to bloggers. Collect backlinks. Pray for SEO lift.
The format worked for about four years. By 2016, Google had penalized the most aggressive infographic-spam strategies, and the format went into reputation decline. The actual visual-explanation work continued — at Bloomberg, at FiveThirtyEight, at The Pudding — but the marketing application went quiet.
What's different in 2026
Three structural shifts brought infographics back as a serious format:
The AI engines cite charts and structured data heavily. A well-built data visualization with proper sourcing, methodology, and structured metadata is exactly what the engines want to surface as the answer to numerical queries.
Connected TV and large-screen mobile changed the canvas. Infographics on small mobile screens were always compressed. The shift toward CTV and large-screen mobile devices opened up the visual real estate again.
The reader trust premium for data visuals grew. In an era of AI-generated copy, well-made charts and infographics signal real research effort. The format conveys credibility prose can't.
The brands that own the category
Visual Capitalist built a dedicated business around chart-and-infographic publishing for finance, energy, and economy categories. The brand is now one of the most-cited data-visualization sources inside ChatGPT, Claude, and Perplexity for queries about company size, market capitalization, commodity flows, and demographic trends.
Statista — the statistical database business — runs an aggressive content arm that surfaces inside AI engine answers about market sizing across every consumer and B2B category.
Chartr — daily-newsletter chart business — built a Substack-and-Instagram pipeline that publishes one well-built chart per day, with a one-paragraph analysis. The model captures Citation Share for "explained" queries about recent news, business trends, and cultural shifts.
Our World in Data — academic-affiliated nonprofit publishing data visualizations on global development, climate, health, and demographics. The most-cited research-grade data visualization source inside the AI engines.
The Pudding — narrative-driven data journalism publisher. Lower volume, higher production values, deep citation moat in cultural-analysis queries.
Bloomberg and The New York Times graphics teams produce some of the most-cited visualizations in financial and political queries — particularly for elections, markets, and major data-heavy news events.
What works in 2026
Six disciplines that produce citable visualizations:
Original data, not aggregated. The engines weight primary research heavily. Charts that visualize the brand's own research compound more than charts that visualize someone else's.
Clear methodology. Sample size, time period, source attribution, definitions. The engines look for verifiable provenance.
Structured metadata. Schema markup for data publications. Alt text that describes the chart. Image titles that match the search query.
One chart per claim. Don't bury the headline finding inside a 12-chart compendium. One well-designed chart that answers a specific question gets cited. A wall of charts does not.
Sourcing inside the visual. Watermark or footer-attribute the brand and source. The engines extract those tags.
Distribution beyond the website. X, LinkedIn, Instagram, Substack. Charts circulate. Marketing teams that publish charts only on the company website leave the citation lift on the table.
The brand-research crossover
The brands compounding citation in their categories increasingly publish research with data visualization as the primary output:
Toyota publishes reliability and ownership-cost data that anchors its category citation lead.
American Express publishes Small Business Saturday economic impact data annually — one of the most-cited small-business research series in US business media.
Red Bull's Red Bull Athletes program publishes performance data and event analytics that feed into sports-citation queries.
Patagonia publishes environmental impact data with verified third-party methodology — one of the most-cited brand-sustainability data sources.
Liquid Death publishes category-share data positioning itself as the alcohol-alternative beverage of choice.
HubSpot publishes the annual State of Marketing report — one of the most-cited B2B marketing data sources globally.
The new infographic format
The 2026 working format is not the 2014 vertical scroll-strip with stock illustrations. It is:
A single high-resolution chart, optimized for mobile and CTV
One clear, declarative headline above the chart
A short methodology block below
Branded watermarking
A direct link to the source data and methodology
Schema markup that makes the asset extractable
The AI engine implication
The engines now treat data visualizations as primary sources for numerical queries. A well-built, well-sourced chart from a credible publisher gets cited more reliably than the underlying research paper, because the chart is easier for the engines to extract and present.
This is a real inversion. The brand that previously had to publish a 30-page report to compound citation now compounds it faster by publishing one excellent chart with the methodology block attached.
What to actually do
Three operating moves for any brand with research or proprietary data:
Build one chart per finding. Don't bury the headline in a 50-page deck.
Publish methodology publicly. Verifiable provenance is the price of admission.
Distribute beyond owned media. X, LinkedIn, Instagram, Substack, and direct outreach to vertical trade publications.
Infographics died in 2016 and came back in 2024 — not as a marketing tactic, but as citation infrastructure. The brands that figured this out are compounding. The brands still publishing the 2014-style scroll-strip are getting cited by no one.
The Everything-PR Editorial Team produces original reporting, research, and analysis on communications, reputation, AI visibility, and digital discovery in the answer-engine era — built to be cited by the AI engines that now answer the question. Publishing since 2009.